The Email That Changed My Workflow
I stared at the MIMIC-III credentialing confirmation email and felt a weird mix of pride and frustration.
I had spent weeks getting approved - professor recommendation, school endorsement, PhysioNet verification, a signed data use agreement. Now I had real ICU data from nearly 50,000 patients. The problem? I could not use ChatGPT, Claude, or any cloud AI to help me work with it.
The data use agreement was clear: this data stays local. Period.
Most people I know building ML projects have an AI copilot in their editor, a chat window on the side, and maybe a few API calls to summarize papers. I had to figure out a different way.
This is the story of how I built a reproducible ICU mortality predictor for UT Austin's AI in Healthcare course (MSAI program) - using only local, open-weight LLMs running on a single MacBook Pro.
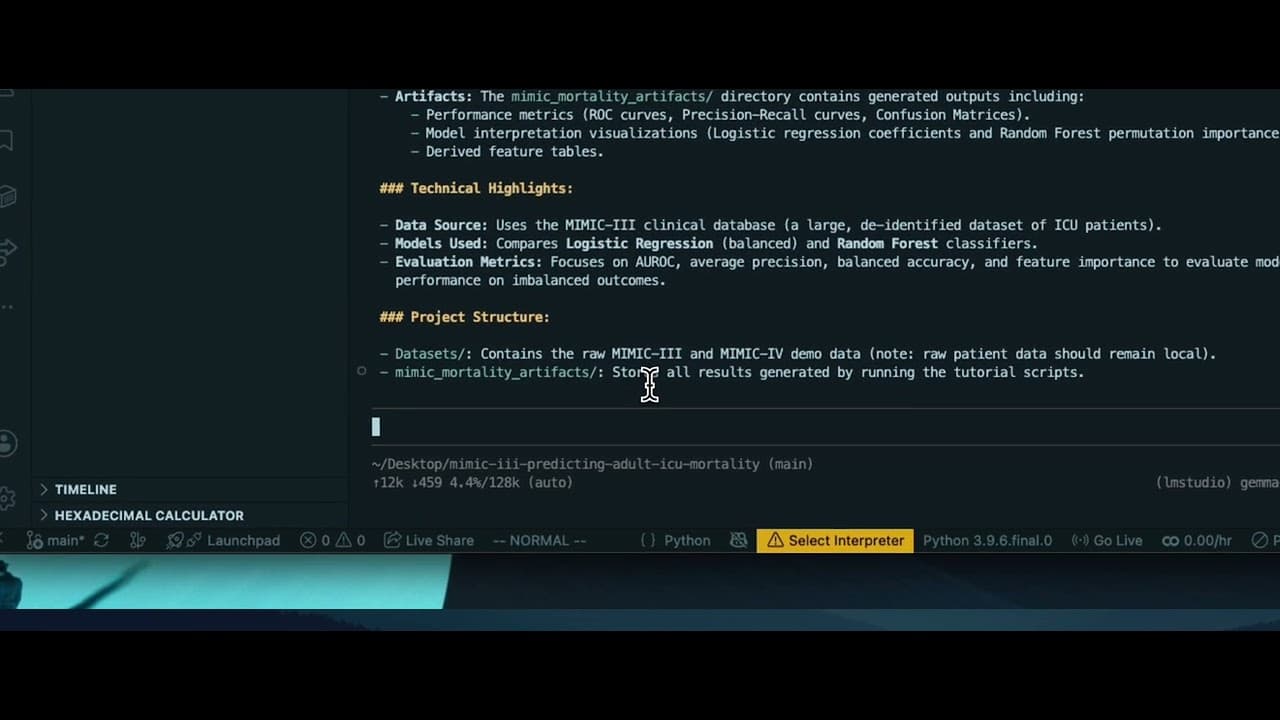
ICU Mortality Predictor - Local LLMs on Healthcare Data
Why MIMIC-III Doesn't Work Like a Kaggle Dataset
MIMIC-III is a credentialed database of de-identified electronic health records from Beth Israel Deaconess Medical Center, containing over 40,000 critical care patients. Accessing it requires:
- Completing a CITI data protection training course
- Getting a recommendation from your professor
- Receiving institutional endorsement from your university
- Submitting a formal application to PhysioNet
- Signing a legally binding data use agreement
I mention this not to complain - it is actually the right thing. These are real ICU stays. Some of those patients did not survive. The friction exists because the data represents real people, and the system is correctly designed to protect them.
But once you have access, you face a new problem: the tooling.
Here is what my normal development workflow looks like:
Open VS Code → AI copilot autocompletes → Alt-tab to ChatGPT for
debugging → paste API output for summarization → push to GitHub
Here is what the MIMIC-III data use agreement says about that workflow:
You may not upload, transmit, or otherwise make the data available to any third-party service, including cloud-based AI platforms.
Translation: ChatGPT, Claude, Copilot, Gemini - all of them are off-limits if they involve sending data off your machine. Even if you are just asking an LLM to help you write a pandas query, if the patient data is in your working context, you cannot use a cloud model.
This is not a preference. It is a legal and ethical boundary.
The Local Stack
So I did what any reasonable person with a MacBook Pro and 24GB of RAM would do: I ran the models locally.
My setup:
Component | Spec |
|---|---|
Laptop | MacBook Pro M5 |
RAM | 24 GB |
Storage | 1 TB SSD |
Model server | LM Studio |
Agentic coding CLI | Pi.dev (connects to LM Studio's local API) |
The models I used, all running on-device:
# Clinical reasoning and domain knowledge
# Q4_K_M: balanced quality/size, fits ~8GB in memory
lmstudio run gemma-4-12b-it-Q4_K_M

# Pipeline code generation and refactoring
# Q3_K_L: aggressive quantization for the 30B model, still coherent for code
pi run --model qwen3-coder-30b-Q3_K_L

# Quick utility tasks, faster turnaround
# Q6_K: high precision, small enough to run alongside everything else
lmstudio run qwen3.5-9b-Q6_K
Why these quantization levels matter on 24GB RAM:
Model | Params | Quant | Approx. Memory | Purpose |
|---|---|---|---|---|
Gemma 4 | 12B | Q4KM | ~8 GB | Clinical reasoning |
Qwen3 Coder | 30B | Q3KL | ~14 GB | Code generation |
Qwen3.5 | 9B | Q6_K | ~7 GB | Utility / fast tasks |
You cannot run all three simultaneously on 24GB - memory management becomes part of the workflow. In practice, I would load Gemma for feature selection and clinical validation discussions, then swap to Qwen3 Coder when it was time to write the pipeline.
I used Pi.dev for the agentic coding loop - it connects to LM Studio's local API and acts as a real coding agent, not just a chat window. This was critical because it could iterate: when the first pass had a memory issue on the full lab events table, Pi.dev proposed the chunked approach, implemented it, and verified it worked, all within the local inference loop.
What Gemma Taught Me About the Data
The most valuable thing Gemma did wasn't writing code - it was helping me think through the clinical logic of the features I was engineering.
I fed Gemma this prompt:
Given 12 lab tests drawn in the first 24 hours of an ICU stay (bicarbonate, BUN, chloride, creatinine, glucose, hematocrit, hemoglobin, lactate, platelets, potassium, sodium, WBC), which are most physiologically linked to short-term mortality? Explain the mechanism, not just correlations.
Gemma's response (local, no data uploaded):
Lactate is the single strongest marker of tissue hypoperfusion and anaerobic metabolism. Elevated lactate indicates that cells are not getting enough oxygen - the hallmark of shock. In critical care, lactate clearance (how fast levels drop) is used to assess resuscitation success. A persistently high lactate in the first 24 hours is a red flag that the patient is not stabilizing.
This clinical reasoning directly informed my feature engineering. Instead of blindly throwing all labs into the model, I paid special attention to constructing meaningful summary statistics (min, max, mean, count) for the labs that Gemma highlighted as physiologically relevant.
Gemma also helped me reason through the imbalanced classification problem:
With an 11.55% mortality rate, your model will achieve 88.45% accuracy by predicting "survived" for everyone. AUROC and average precision are more honest metrics. AUROC tells you about discrimination; average precision tells you how well you are finding the needles in the haystack.
This is exactly the kind of reasoning you would normally get from a cloud LLM - but here, it happened entirely on-device, with no data leaving my machine.
I ran five reasoning prompts like this with Gemma - covering feature selection, the creatinine paradox, metric selection for imbalanced data, cohort definition bias, and lactate physiology. All 11 prompts across all three models are in the appendices at the end of this post.
What Qwen3 Coder Built
Qwen3 Coder 30B (Q3KL) handled the heavy lifting of code generation. Even at aggressive quantization, it produced clean, production-quality Python for the full ML pipeline.
The prompt I used with Pi.dev:
Build a reproducible ML pipeline in a single Python script that: 1. Reads MIMIC-III v1.4 CSVs 2. Defines a cohort (adults, first ICU stay, exclude NICU) 3. Engineers first-24-hour lab features with min/max/mean/count 4. Handles missing values (median impute numeric, mode for categorical) 5. Trains class-balanced logistic regression and random forest 6. Reports AUROC, average precision, balanced accuracy 7. Exports all figures and metrics to an artifacts/ directory 8. Caches the feature table so re-runs are fast
The full pipeline prompt above was the starting point - I later ran prompts for modular refactoring, visualization exports, and a bug fix for identifier leakage. See the appendices for the complete set.
The output: a 482-line Python script (mimic_mortality_tutorial.py) that does all of the above, including chunked processing of the 30M+ row LABEVENTS table:
# Chunked processing of massive lab events table
CHUNK_SIZE = 750_000

# Build feature table from labs, chunk by chunk
for chunk in pd.read_csv(
    LABEVENTS_PATH,
    chunksize=CHUNK_SIZE,
    compression="gzip",
    dtype={"VALUENUM": "float32"},
):
    chunk = chunk[chunk["ITEMID"].isin(LAB_ITEMS.keys())]
    chunk["CHARTTIME"] = pd.to_datetime(chunk["CHARTTIME"])
    # filter to first 24 hours, compute summary stats
The complete pipeline architecture:
from sklearn.pipeline import Pipeline
from sklearn.compose import ColumnTransformer
from sklearn.impute import SimpleImputer
from sklearn.preprocessing import StandardScaler, OneHotEncoder

# Numeric: median impute + scale
# Categorical: mode impute + one-hot encode
preprocessor = ColumnTransformer([
    ("num", Pipeline([
        ("imputer", SimpleImputer(strategy="median")),
        ("scaler", StandardScaler()),
    ]), numeric_cols),
    ("cat", Pipeline([
        ("imputer", SimpleImputer(strategy="most_frequent")),
        ("encoder", OneHotEncoder(handle_unknown="ignore")),
    ]), categorical_cols),
])

# Class-balanced models
models = {
    "Logistic Regression": LogisticRegression(
        class_weight="balanced", solver="lbfgs", max_iter=1000,
        random_state=42,
    ),
    "Random Forest": RandomForestClassifier(
        n_estimators=160, min_samples_leaf=25,
        class_weight="balanced_subsample",
        n_jobs=1, random_state=42,
    ),
}
The Results
After all that - the credentialing, the local model setup, the memory juggling - here is what the pipeline produced on 49,695 adult ICU admissions with an 11.55% mortality rate:
Metric | Logistic Regression | Random Forest |
|---|---|---|
AUROC | 0.814 | 0.842 |
Avg Precision | 0.414 | 0.472 |
Balanced Accuracy | 0.734 | 0.738 |
What the models agreed on: Lactate (mean, min, max) dominated the random forest's permutation importance. BUN and age followed. This aligns perfectly with clinical knowledge - tissue hypoperfusion, kidney dysfunction, and advanced age are the triad of critical illness severity.
Where they diverged: Logistic regression put creatinine at the top, but with a counterintuitive negative coefficient for creatinine mean (higher creatinine associated with lower mortality). This is likely a survival-time confound: patients who die quickly do not have time for repeat creatinine draws. The random forest - being non-linear - handled this nuance better, giving the top spot to lactate instead.
!ROC curve ROC curve - Random Forest achieves AUROC 0.842 on held-out test set.
!Feature importance Random forest permutation importance - lactate features dominate the top predictors.
What This Means for Healthcare AI
Here is the thing: local LLMs are not just for privacy enthusiasts or people who do not want to pay for API credits. They are infrastructure for a compliance-viable healthcare AI workflow.
The stack that actually works on protected health data:
Local model (clinical reasoning) → Local model (code generation)
        ↓                                      ↓
   Human-in-the-loop validation          Reproducible pipeline
        ↓                                      ↓
              → Aggregate, de-identified artifacts
                     (safe to share publicly)
Cloud AI gets you speed. Local AI gets you compliance. In healthcare, compliance is not negotiable.
The models I used - Gemma 4 12B, Qwen3 Coder 30B, Qwen3.5 9B - are open-weight and free. The entire setup ran on a laptop with 24GB RAM. This is not a future-state prediction; it is working today, on consumer hardware, for real clinical ML projects.
Appendices: All Prompts Used During Development
All models ran locally - no patient data ever left the machine. The same file is also in the project repo.
Gemma 4 12B (Clinical Reasoning)
lmstudio run gemma-4-12b-it-Q4_K_M- Feature selection rationale
I have 12 lab tests from MIMIC-III: bicarbonate, BUN, chloride, creatinine, glucose, hematocrit, hemoglobin, lactate, platelets, potassium, sodium, WBC. Which 5 are most physiologically tied to short-term ICU mortality, and why should I prioritize certain aggregation functions (min vs mean vs max) over others for each?
- Interpreting a counterintuitive coefficient
My logistic regression shows creatinine mean has the largest negative coefficient (-3.77) - higher mean creatinine appears protective. But clinically, high creatinine means kidney injury. Explain the survival-time confound here and whether I should trust it or let the random forest handle it.
- Imbalanced classification guidance
My mortality rate is 11.55% (5,739/49,695). I'm comparing class-balanced logistic regression vs random forest with
balanced_subsample. Walk me through which metric I should optimize - AUROC, average precision, or balanced accuracy - and why the model that finds more true positives (845 vs 715 for LR) might still be worse overall.
- Cohort definition validity
I'm excluding NICU stays, capping age at 90 (MIMIC date-shifting), and keeping only first ICU stays per admission. What biases could each of these decisions introduce for a mortality prediction model?
- Lactate dominance in random forest
My random forest permutation importance shows lactate mean, min, and max occupy 3 of the top 4 spots, with lactate mean alone causing a 0.031 drop in average precision when permuted. Explain the physiology of why lactate dominates - should I add lactate clearance rate as a feature?
Qwen3 Coder 30B (Code Generation)
pi run --model qwen3-coder-30b-Q3_K_L- Full pipeline build
Write me a single Python script
mimic_mortality_tutorial.pythat: - Reads MIMIC-III v1.4 CSVs from../Datasets/mimiciii/1.4/- Builds an adult ICU cohort (age >= 18, first ICU stay, exclude NICU) - Engineers first-24-hour lab features with min/max/mean/count per patient - Handles missing values (median impute numeric, mode for categorical) - Trains class-balanced logistic regression and random forest - Reports AUROC, average precision, balanced accuracy - Exports all figures and metrics tomimic_mortality_artifacts/- Caches the feature table so re-runs are instant - Usechunksize=750_000on LABEVENTS to avoid memory blowup on 30M rows
- Refactor for modularity
Refactor the pipeline so
build_feature_table,aggregate_first24_labs, andtrain_and_evaluateare independent functions with aTutorialResultsdataclass. The feature building should use chunked CSV reading; the training should use sklearn Pipelines with ColumnTransformer.
- Add visualization to existing code
Add figure exports to the
train_and_evaluatefunction: ROC curve, precision-recall curve, confusion matrix for the best model, logistic regression coefficient bar chart (top 15, color positive red, negative blue), and random forest permutation importance bar chart. Save tomimic_mortality_artifacts/at 180 DPI.
- Fix a specific issue
My logistic regression is fitting on all features including the identifier columns
SUBJECT_ID,HADM_ID,ICUSTAY_ID, andINTIME. Fix the training code to drop these before fitting. Use name-based exclusion, not positional, so it's robust to column reordering.
Qwen3.5 9B (Quick Utility Tasks)
lmstudio run qwen3.5-9b-Q6_K- Inspect LABEVENTS structure
Read the first 5 rows of
Datasets/mimiciii/1.4/LABEVENTS.csv.gz, show all columns and dtypes, count unique ITEMIDs, and tell me the memory footprint of loading it without chunking.
- Quick plotting fix
In my ROC curve export, the legend overlaps the curve at lower-right. Move it to lower-center below the x-axis. Also change the chance line from solid to dashed with alpha 0.5.
- Generate LAB_ITEMS dict
I have these MIMIC-III lab ITEMIDs: 50882, 50902, 50912, 50931, 50971, 50983, 51006, 51221, 51222, 51265, 51301, 50813. Write me a Python dict mapping each to its standard lab name (e.g. 50882: bicarbonate). Load D_ITEMS to verify.
- Summarize model results
Read
mimic_mortality_artifacts/model_results.jsonand pretty-print a markdown table of the metrics, plus print the cohort size and mortality rate in a sentence.
- Git hygiene check
Show me
git status, the diff of any unstaged changes, and the last 5 commits with--oneline. Tell me if there are untracked files I should.gitignore.
Reproducing This Setup
If you are working with credentialed healthcare data and want to replicate this workflow, here is exactly what you need:
Hardware:
- MacBook Pro M5, 24GB RAM, 1TB SSD (or equivalent with 24GB+)
Software:
- LM Studio - download models, serve local API
- Pi.dev CLI - agentic coding against local models
- Python 3.11+, scikit-learn, pandas, matplotlib, seaborn
Models:
gemma-4-12b-it-Q4_K_M- clinical reasoningqwen3-coder-30b-Q3_K_L- code generationqwen3.5-9b-Q6_K- quick utility tasks
My project repo (code + artifacts, no patient data): github.com/Zeraphim/mimic-iii-predicting-adult-icu-mortality
If you are building something similar - or trying to figure out how to do AI-assisted development on protected clinical data - reach out. I am happy to share what worked and what did not. DMs are open.
Built for UT Austin's AI in Healthcare course, MSAI program. Data from MIMIC-III v1.4 (PhysioNet). Models run locally. No patient data ever left my machine.